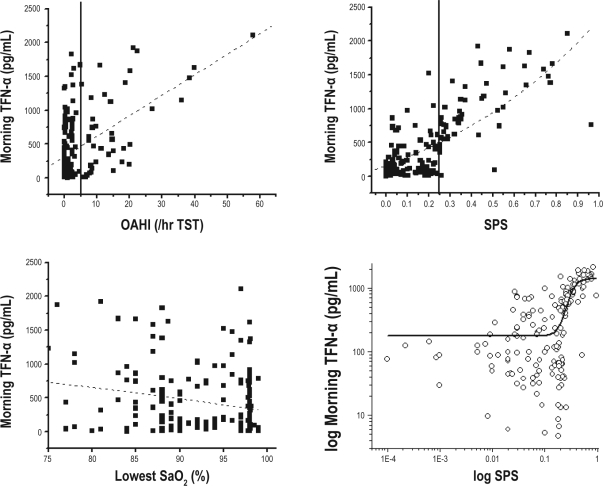
Figure 1.
Scattergrams of individual tumor necrosis factor (TNF)-α morning plasma levels plotted against corresponding obstructive apnea-hypopnea index (OAHI), nadir SaO2, and sleep pressure score (SPS) in 270 habitually snoring children and 28 nonsnoring control subjects. Linear regression lines are shown and were highly signicant for OAHI (r2: 0.24; P < 0.001) and SPS (r2: 0.52; P < 0.000001) but not with nadir SaO2 (r2: 0.05; p > 0.05). The vertical lines show OAHI = 5 and SPS = 0.25 as cutoffs for disease severity. The right bottom panel shows log TNF-α plotted against log SPS, with the vertical line representing SPS = 0.25 whereas the curvilinear line represents the sigmoidal t function (r2: 0.64; P < 0.00000001). Please note the marked take off of TNF-α morning plasma concentrations once SPS exceeds the 0.25 cutoff value (7).

