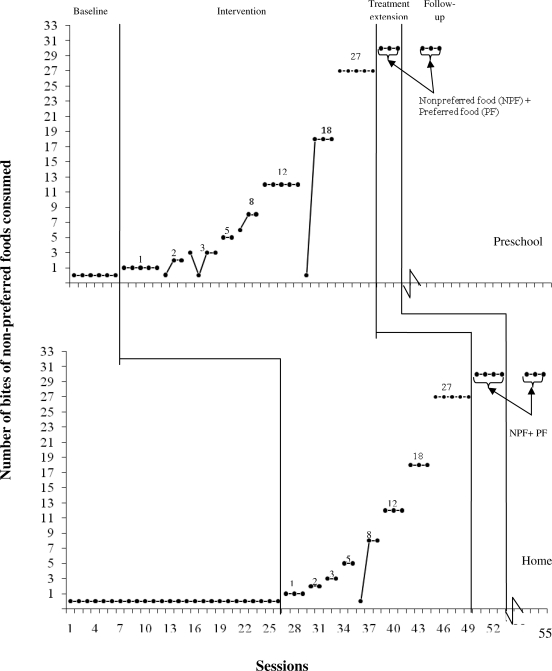
Figure 1.
Number of bites of nonpreferred foods John consumed during baseline and intervention sessions, and number of bites of nonpreferred and preferred foods consumed in treatment extension and follow-up. The numbers above the data path indicate the change in the reinforcement criterion in the intervention phase.

