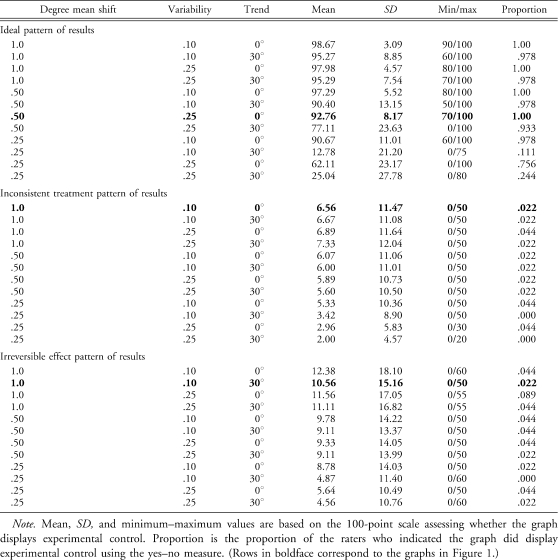
Table 1.
Mean, Standard Deviation, Minimum and Maximum Values, and Proportion of Graphs Indicated as Demonstrating Experimental Control at Each Combination of Stimuli
| Degree mean shift | Variability | Trend | Mean | SD | Min/max | Proportion |
| Ideal pattern of results | ||||||
| 1.0 | .10 | 0° | 98.67 | 3.09 | 90/100 | 1.00 |
| 1.0 | .10 | 30° | 95.27 | 8.85 | 60/100 | .978 |
| 1.0 | .25 | 0° | 97.98 | 4.57 | 80/100 | 1.00 |
| 1.0 | .25 | 30° | 95.29 | 7.54 | 70/100 | .978 |
| .50 | .10 | 0° | 97.29 | 5.52 | 80/100 | 1.00 |
| .50 | .10 | 30° | 90.40 | 13.15 | 50/100 | .978 |
| .50 | .25 | 0° | 92.76 | 8.17 | 70/100 | 1.00 |
| .50 | .25 | 30° | 77.11 | 23.63 | 0/100 | .933 |
| .25 | .10 | 0° | 90.67 | 11.01 | 60/100 | .978 |
| .25 | .10 | 30° | 12.78 | 21.20 | 0/75 | .111 |
| .25 | .25 | 0° | 62.11 | 23.17 | 0/100 | .756 |
| .25 | .25 | 30° | 25.04 | 27.78 | 0/80 | .244 |
| Inconsistent treatment pattern of results | ||||||
| 1.0 | .10 | 0° | 6.56 | 11.47 | 0/50 | .022 |
| 1.0 | .10 | 30° | 6.67 | 11.08 | 0/50 | .022 |
| 1.0 | .25 | 0° | 6.89 | 11.64 | 0/50 | .044 |
| 1.0 | .25 | 30° | 7.33 | 12.04 | 0/50 | .022 |
| .50 | .10 | 0° | 6.07 | 11.06 | 0/50 | .022 |
| .50 | .10 | 30° | 6.00 | 11.01 | 0/50 | .022 |
| .50 | .25 | 0° | 5.89 | 10.73 | 0/50 | .022 |
| .50 | .25 | 30° | 5.60 | 10.50 | 0/50 | .022 |
| .25 | .10 | 0° | 5.33 | 10.36 | 0/50 | .044 |
| .25 | .10 | 30° | 3.42 | 8.90 | 0/50 | .000 |
| .25 | .25 | 0° | 2.96 | 5.83 | 0/30 | .044 |
| .25 | .25 | 30° | 2.00 | 4.57 | 0/20 | .000 |
| Irreversible effect pattern of results | ||||||
| 1.0 | .10 | 0° | 12.38 | 18.10 | 0/60 | .044 |
| 1.0 | .10 | 30° | 10.56 | 15.16 | 0/50 | .022 |
| 1.0 | .25 | 0° | 11.56 | 17.05 | 0/55 | .089 |
| 1.0 | .25 | 30° | 11.11 | 16.82 | 0/55 | .044 |
| .50 | .10 | 0° | 9.78 | 14.22 | 0/50 | .044 |
| .50 | .10 | 30° | 9.11 | 13.37 | 0/50 | .044 |
| .50 | .25 | 0° | 9.33 | 14.05 | 0/50 | .044 |
| .50 | .25 | 30° | 9.11 | 13.99 | 0/50 | .022 |
| .25 | .10 | 0° | 8.78 | 14.03 | 0/50 | .022 |
| .25 | .10 | 30° | 4.87 | 11.40 | 0/60 | .000 |
| .25 | .25 | 0° | 5.64 | 10.49 | 0/50 | .044 |
| .25 | .25 | 30° | 4.56 | 10.76 | 0/60 | .022 |
Note. Mean, SD, and minimum–maximum values are based on the 100-point scale assessing whether the graph displays experimental control. Proportion is the proportion of the raters who indicated the graph did display experimental control using the yes–no measure. (Rows in boldface correspond to the graphs in Figure 1.)

