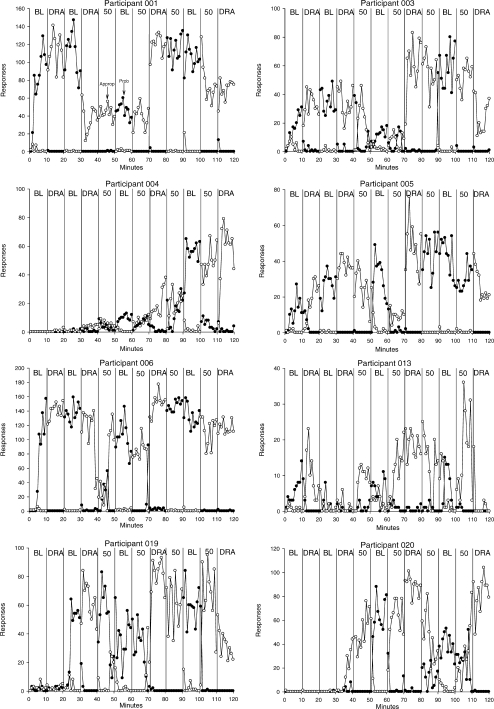
Figure 5.
Results for some of the participants in Subset 4, who were exposed to 50% integrity following baseline and full treatment. Each panel shows results for a participant. All of these participants showed some evidence of switching between baseline or treatment and error phases. Filled circles denote rates of clicking on the black object (problem behavior), and open circles denote rates of clicking on the red object (appropriate behavior). Condition labels show baseline (BL), DRA, and treatment integrity failure phases. During integrity failures, condition labels show the treatment integrity percentage.

