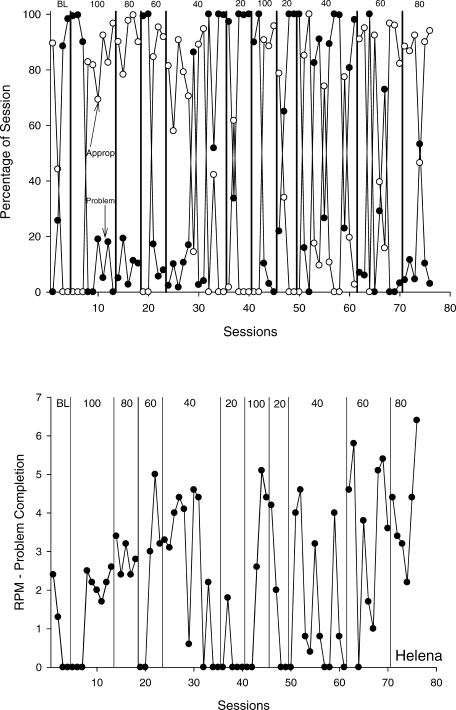
Figure 6.
Treatment integrity assessment results for Helena. The top panel shows percentage of the session spent on or off task by the open and filled circles, respectively. Condition labels show baseline (BL), DRA, and treatment integrity failure phases. During integrity failures, condition labels show the treatment integrity percentage. The bottom panel shows the rate at which Helena completed math problems during the assessment.

