
Figure 2.
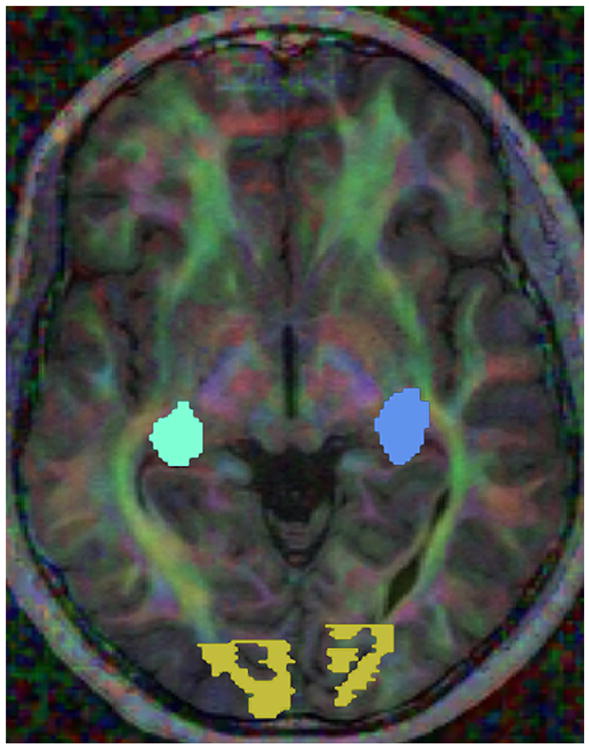
Visualization of white matter connectivity with color coding based on the orientation of the primary eigenvector of each diffusion tensor, with intensity proportional to the fractional anisotropy (red for left-right, blue for superior-inferior, and green for anterior-posterior). Regions of interest in the lateral geniculate nuclei (blue tones) and visual cortex (yellow) are also shown.