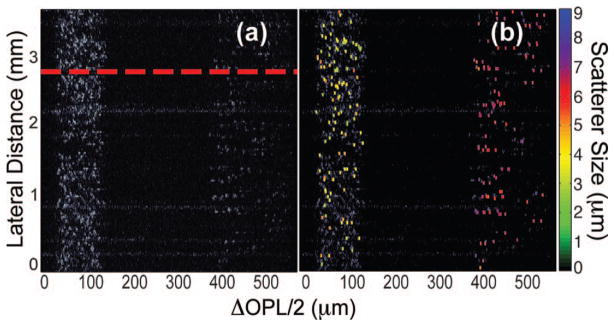
Fig. 1.
(a) Parallel frequency-domain OCT image of a two-layer phantom. The top layer (optical path length difference/2 (ΔOPL/2) ranging from 35 to 125 μm) contains 4.00 μm beads, while the bottom layer (400–550 μm) contains 6.98 μm beads. The dashed red line corresponds to a single lateral channel from which the TFD illustrated in Fig 2 is generated. (b) Overlay of the fLCI measurements with the OCT image. Scatterers without color coding correspond to points that produced nonunique size measurements.

