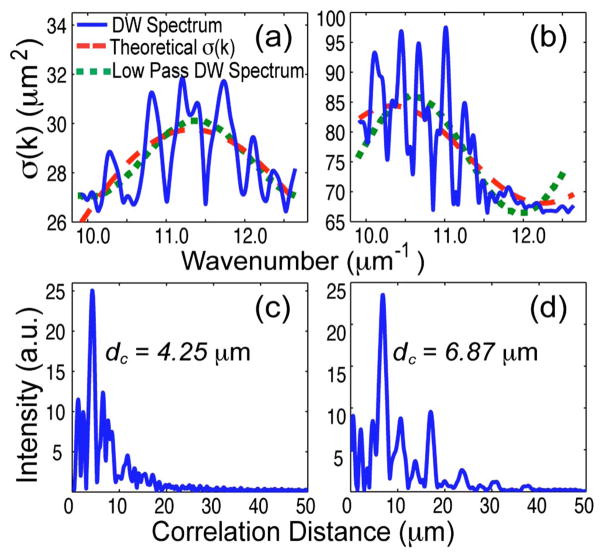
Fig. 3.
(Color online) (a)–(b) DW spectral profiles (blue curves) and low-pass filtered spectra (dotted green curves) from points 1 and 2 in Fig. 2(b), respectively. Dashed red curves are the theoretical scattering cross sections for 3.97 and 6.91 μm spherical scatterers for points 1 and 2, respectively, obtained by least-squares fitting the low-pass filtered spectrum. (c)–(d) Correlation function from points 1 and 2, with correlation distances (dc) of 4.25 and 6.87 μm, respectively.

