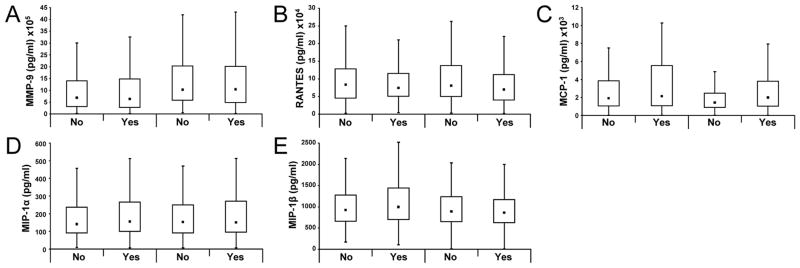
Figure 2.
Box and whisker plots (with fences added as whiskers) of MMP 9 (A), RANTES (B), MCP 1 (C), MIP 1α (D) and MIP 1β (E) on days 1 (within 4 hours of birth) and 3 of age in the two groups with differential O2 exposure. These fences show the most extreme observed values within {Q3 + (1.5*IQR)} for the upper fence, or within {Q1 − (1.5*IQR)} for the lower fence.

