
Figure 1.
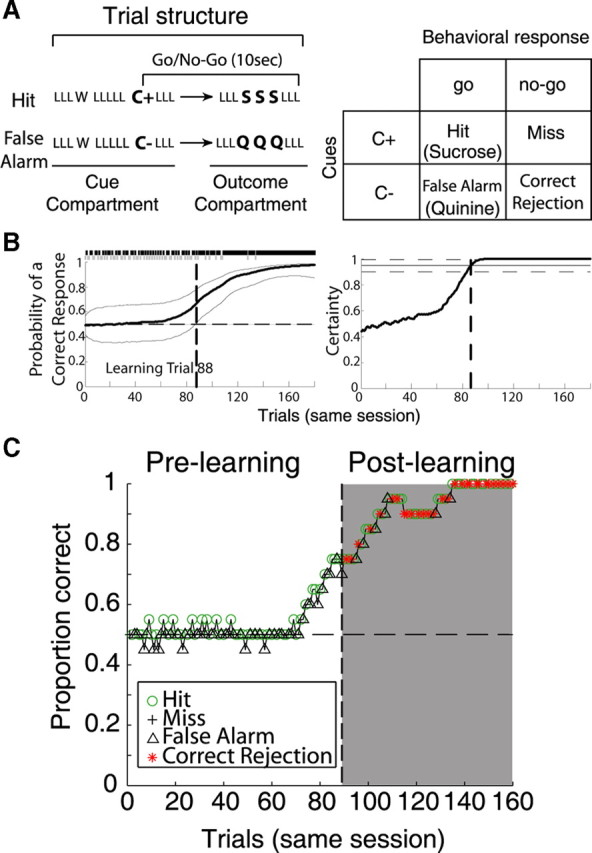
Taste discrimination and performance in a go/no-go response task. A, In each trial, after a door opens (data not shown), rats approached a sipper, and then licked (L) an empty sipper three times, whereon on the fourth lick they received water (W). They then licked the empty sipper another five times and on the 10th lick, they received a cue of either 0.1 m NaCl or 0.1 m MPG. In positive cue trials, C+, one of the arbitrary taste cues, signals the availability of reward [0.4 m sucrose (S), up to 3 drops, 1 per lick], whereas in negative cue trials, C−, the other taste cue signaled the availability of a bitter tastant [1 mm quinine HCl (Q)]. After cue delivery, subjects had 10 s to leave the cue compartment and move to the outcome compartment—located at the right side of the box—where after three additional empty licks, they received either sucrose or quinine. Right, Depending on the type of cue (C+ or C−) and behavioral response (go/no-go), trials were classified as hit, miss, false alarm, or correct rejection. For example, hit is when C+ was delivered and the subject made a go response, whereas a correct rejection occurred when C− was delivered and the subjects withheld a go response to avoid punishment. Note that positive trials (C+) are the combination of hits and misses, whereas negative trials (C−) are the combination of false alarms and correct rejections. B, left, shows a representative learning curve (bold black line, and confidence interval) from a single session that was analyzed using the state-space smoothing algorithm. The learning curve combines both cues in the order originally presented. The top bar shows the sequence of an incorrect (0) and correct (1) behavioral responses, in which a gray tick represents an incorrect response (false alarm and miss) and black mark a correct response (hit and correct rejection). From this binary vector, the trial that divides prelearning from postlearning trials (the learning trial) (dashed vertical line) was calculated as described in Materials and Methods. Note that the learning curve has a sigmoidal shape, suggesting that the learning process is gradual. Therefore, the learning trial does not mean that learning occurred in that trial; instead, it reflects the point at which the subject began performing above chance level. The right panel shows the extent of certainty of that of an ideal observer (that is, one that has knowledge of the performance in the entire session). In this model, the learning trial is located at the trial in which the ideal observer is 95% certain (horizontal solid lines) that the subject is performing above chance level and that correct performance will be maintained for the rest of the session. C, Same session displayed on B, but the learning curve was obtained by the more traditional moving window method (of 20 trial width). In the prelearning phase, the subject's performance was 50%, as during this phase no correct rejections were made (see red stars; *). The apparent increase in performance observed at trial 70 is a result of the 20 trial moving window. Note that this graph only shows 160 of 180 trials, because of smoothing with a 20 trial window width.