Figure 5.
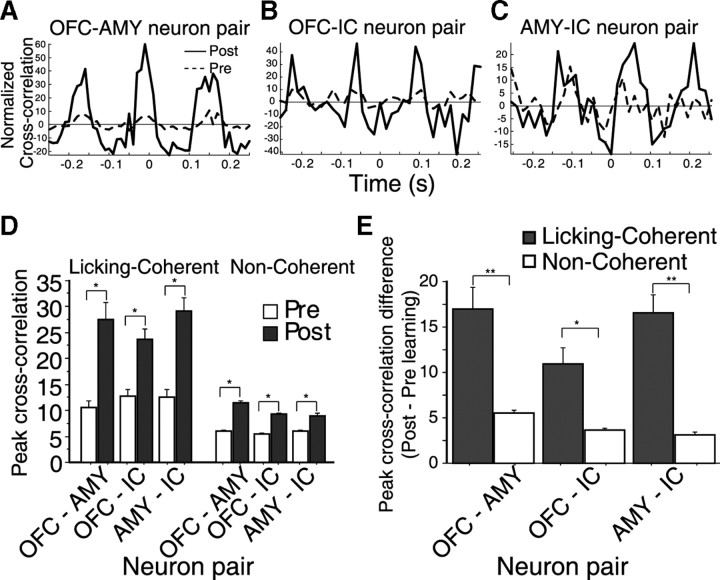
The cross-correlation peaks in pairs of licking-coherent simultaneously recorded neurons in OFC–AMY, OFC–IC, and AMY–IC increased after learning. A–C, Cross-correlations of three pairs of licking-coherent neurons as a function of learning. Each pair was recorded simultaneously (dashed lines, prelearning; solid black lines, postlearning). The two neuron pairs shown in A and B were recorded simultaneously, and in both cases, the OFC neuron was the same. This OFC was a licking-coherent AC cue-selective cell and the neuron in the amygdala for the pair in A was not cue-selective. The neuron in the IC for the pair in B was also non-cue-selective. Note that, after learning, coincident spiking in both pairs (A, B) was enhanced, suggesting that licking-coherent cue-selective neurons from one area can fire in synchrony with non-cue-selective coherent cells from other brain regions and that synchronous spikes between different regions are enhanced after learning (see text for summary of these type of interactions). D, This histogram shows the maximum peak of cross-correlations as a function of learning for pairs of OFC–AMY, OFC–IC, and AMY–IC neurons. Neurons were divided into coherent, if they showed significant coherence in the delay epoch, or noncoherent. We compared pairs of licking-coherent neurons recorded simultaneously in different regions. It is seen that, after learning the peaks of the cross-correlations were significantly larger in all neuron pair combinations (*paired t test, significant value of p < 0.0001). E, This figure shows the normalized peak of cross-correlations (peak post–pre learning) as a function of pairs of OFC–AMY, OFC–IC, and AMY–IC neurons. The normalized peak of cross-correlation was compared between neurons that displayed licking-coherent and noncoherent activity. **0.0001, *0.01, significant p value (Wilcoxon's rank sum test). Error bars indicate SEM.

