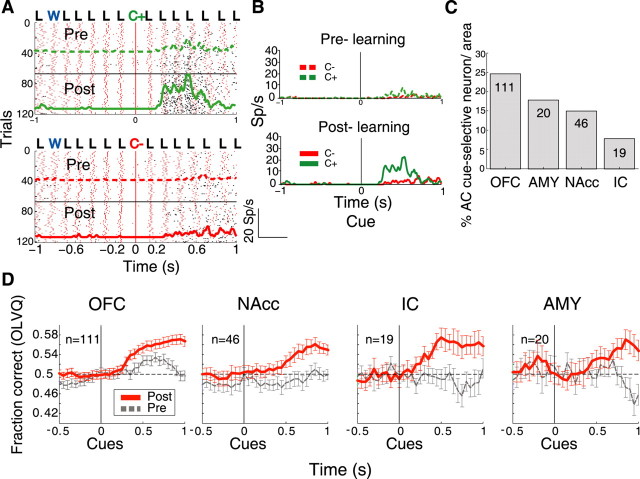
Figure 7.
AC cue-selective neurons: neuronal decoding of cue identity improves with learning. A, Raster plots and PSTHs for an OFC neuron that with training developed stronger activity in C+ trials. In the delay epoch, this neuron became synchronized with licking (coherence, 0.18 at 6.2 Hz; Φ = −2.5 radians). The horizontal black lines separate trials in the prelearning and postlearning phases. B, The PSTHs of the neuron in A, but comparing both cues (C+, green; C−, red) as a function of learning phase. C, Presented is the proportion of AC cue-selective neurons in the postlearning phase sorted by brain region. D, Neural activity from the 196 AC cue-selective neurons in different brain areas that was used to classify the identity of the cues (C+, C−) using an optimized LVQ classifier (see Materials and Methods). Note that the neuronal classification of the cues improved with learning (red solid line, postlearning phase; gray dashed line, prelearning). The horizontal dashed line represents chance classification level. Error bars indicate SEM.

