
Figure 9.
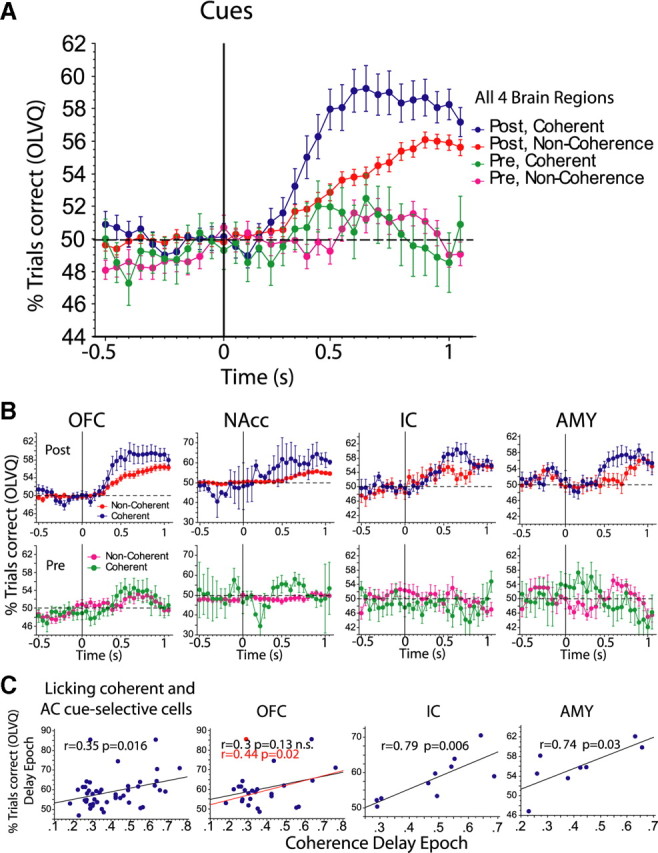
AC cue-selective neurons: neural decoding of cue identity as a function of synchrony and learning. A, Shown are the 196 AC cue-selective neurons that were sorted according to whether or not they showed significant coherence with licking in the delay epoch. Notice that, independently of whether the neurons exhibited synchronous firing with licking from −0.5 to 0 s relative to cue delivery, the classification of the cues was, as expected, below chance levels (horizontal dashed line) in either the prelearning or postlearning phases. However, after cue delivery, the discrimination of the cues slowly increased. The graph also shows that, after learning, licking-coherent neurons (blue dots) were better at discriminating the cues than noncoherent neurons (red dots). B plots cue discrimination (OLVQ performance) as a function of brain region and learning phase. C, The coherence level in the delay epoch correlates with OLVQ cue discrimination in the postlearning phase. The left panel shows the Pearson correlation value (r) between cue discrimination (percentage of trials correctly classified by the OLVQ) of 46 licking coherent and AC cue-selective cells (from all four brain regions) against the amount of coherence that each of these cells displayed in the delay epoch. The adjacent three panels plot the same analysis for each individual brain region. The OFC showed a nonsignificant trend, because of one outlier (red point) that had a low coherence, but an excellent cue discrimination. Reanalysis of the regression omitting this cell reveals a significant correlation between coherence level and cue discrimination (r = 0.44; p = 0.02). A stronger and significant correlation in the IC and the AMY was observed. The same analysis was not possible to perform for the NAcc, since only two neurons were coherent and AC cue selective. For panels in C, we used a single window of spike trains (binned in 10 ms bins) that comprised the entire delay epoch (0.2–1 s, after cue delivery). Error bars indicate SEM.