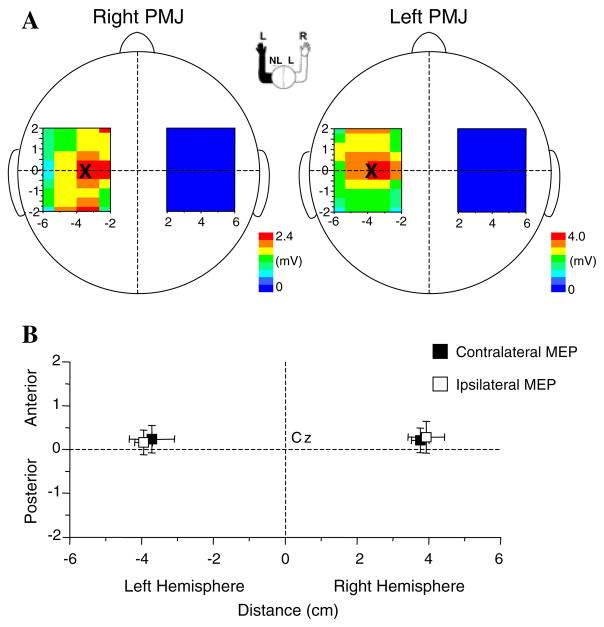
Fig. 4.
a Topographic contour maps of the average MEP amplitude evoked by TMS at each of the sites on the grids over the right and left hemisphere of a single subject. The location of the contralateral (figure on the left) and ipsilateral (figure on the right) center of gravity (CoG) on the non-lesioned hemisphere is marked with an “×”. b Plot of the average CoG across subjects for both the ipsilateral and contralateral projections over each hemisphere. NL non-lesioned hemisphere, L lesioned hemisphere, PMJ pectoralis major

