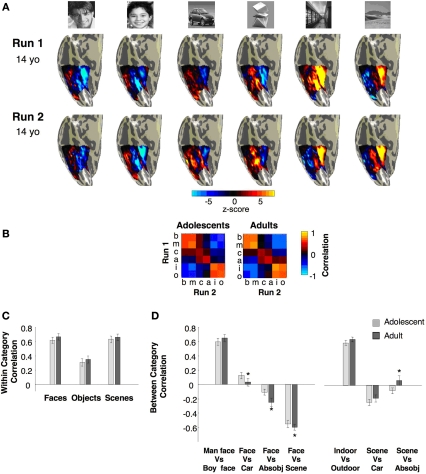
Figure 10.
Multivoxel pattern (MVP) analysis of distributed responses to categories across the right VTC. (A) Visualization of the MVP to stimulus categories in run1 and run2 in a representative 14-year-old adolescent. (B) Group averaged Pearson correlations within and between categories from run1 versus run2. The on-diagonal components indicate the within-category reproducibility of the MVPs across runs, using different exemplars of the same stimulus category. Off-diagonal components indicate between-category correlations. (C) Summary of within-category correlations from (B). (D) Across-category correlations from (B) between faces and non-faces and between scenes and objects. Light grey: adolescents n = 11, ages 12–16 years; Dark grey: adults, n = 11, ages 18–40 years. Asterisks indicate significantly different correlations in adults vs. adolescents (P < 0.02, t-test across subjects). Error bars denote SEM across subjects.

