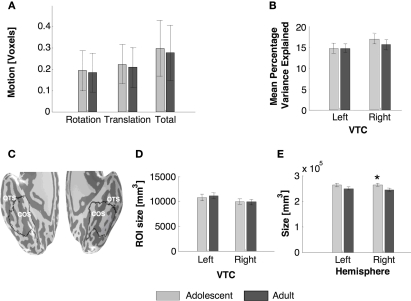
Figure 2.
Measurements of BOLD-related confounds and anatomical size of VTC and total hemispheric gray matter across age groups. (A) Motion during scan for each age group. (B) Average variance explained by the GLM model in the anatomical ROI of ventral temporal cortex (VTC) as shown in (C). The variance explained was measured for each voxel and then averaged across the ROI and across subjects. (C) Representative VTC ROI in an adolescent, OTS: occipito-temporal sulcus; CoS: collateral sulcus. (D) Average volume of the VTC in each age group. (E) Average volume of the total gray matter in each hemisphere for each age group. All bars represent the average across each age group (11 adults and 14 adolescents), error bars show standard error of the mean (SEM) for each age group. Asterisk indicates significantly higher volume in adolescents than adults (P < 0.05, t-test).

