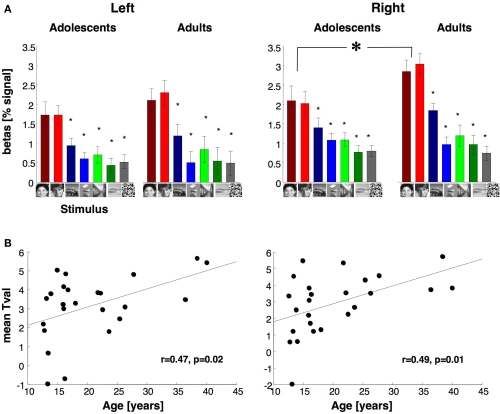
Figure 5.
Average response to different stimuli and face selectivity within face selective regions of fusiform gyrus. (A) Average responses to different image categories (relative to the blank baseline) of face selective voxels during run 2. Data are averaged across 14 adolescents and 11 adults in the right hemisphere and 13 adolescents and 11 adults in the left hemisphere. Face selective voxels were independently defined using run 1 data with the contrast: man and boy > cars and abstract objects, P < 10−3, uncorrected. Error bars indicate SEM across subjects. Small asterisks indicate responses that are significantly less than faces (P < 0.05, t-test across subjects) and are corrected for multiple comparisons using Bonferroni correction. Large asterisk indicates significantly lower responses to faces in adolescents than adults (P < 0.05, t-test across subjects). (B) Face selectivity is plotted as a function of age. Each point represents a subject's mean t-value for the contrast faces vs. objects from run 2 data across all face selective voxels in VTC as in (A).

