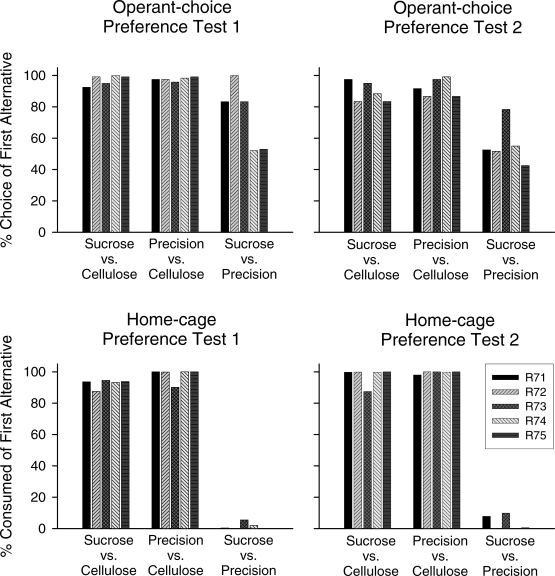
Fig 1.
Results of the preference tests for each rat in Experiment 1. Bars show the percentage choice (upper panels) and percentage consumed (lower panels) of the alternative that appears first in the pairs noted along the x-axis. The upper panels show results from the operant-choice preference tests; the lower panels show results from the home-cage preference tests.

