Figure 1.
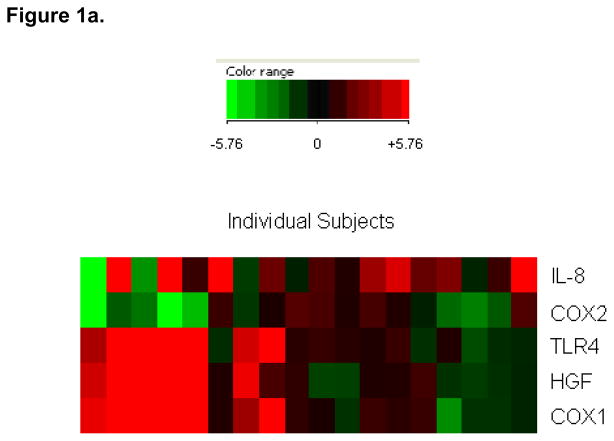
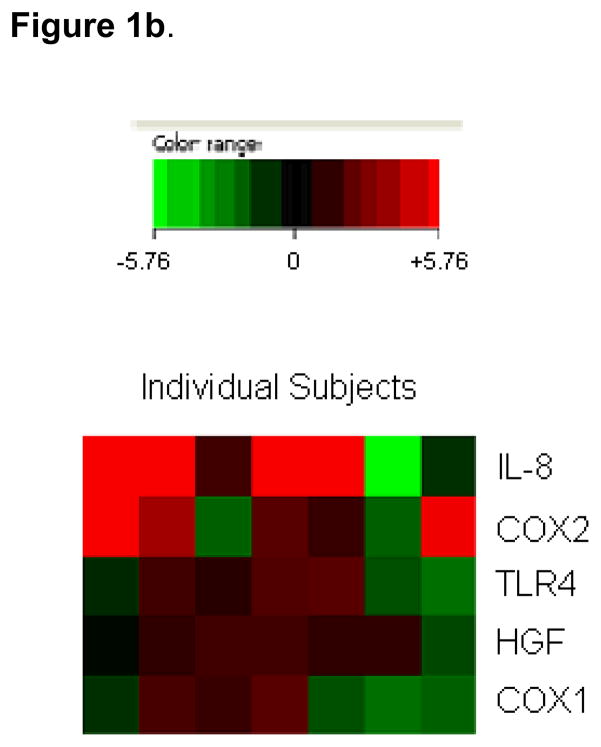
“Heat maps” depicting a subject-by-subject comparison of antral gene fold changes. Each subject is depicted by one column. Each gene is depicted by one row. Only the five genes for which significant differences between ulcer and non-ulcer populations were noted are depicted. Data are presented on a scale from strong up-regulation (bright red) to strong down regulation (bright green) (see more detailed description in Methods).
Figure 1a. Non-ulcer subjects
Figure 1b. Ulcer subjects.
“Heat map” depicting a subject-by-subject comparison of gene fold changes for subjects who developed ulcers.


