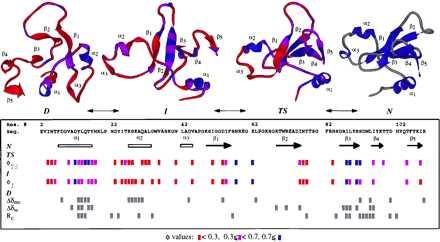
Figure 5.

Summary of the available information on the major states along the folding pathway of barnase. The experimental φ values (21–23) are given in the box and colored according to their magnitude, from red (unstructured) to blue (structured). Chemical shift changes and Rc values suggestive of residual structure and/or regions of low mobility in the denatured state are marked in gray (6, 8, 14). A cut-off of 0.3 was used for the Rc values. Changes smaller in magnitude were considered to be within the noise. Structures from the simulation are given at the top of the figure. D is the 4-ns snapshot, I is the major intermediate state (the average structure from 470 to 730 ps) (26), TS represents the major transition state (the average structure between 135 and 140 ps), and N is the average NMR structure (20). The TS, I, and D structures are colored according to their S values, by using the same scale as for φ. Calculation of S values followed the procedure of Daggett et al. (37); the secondary structure component is based on (φ, ϕ) values, and the tertiary component is the ratio of contacts between nonneighboring residues relative to the extent of contacts in the native simulation (a cut-off of 5.4 and 4.6 Å was used for C—C and all other heavy atom pairs, respectively).
