
Figure 5.
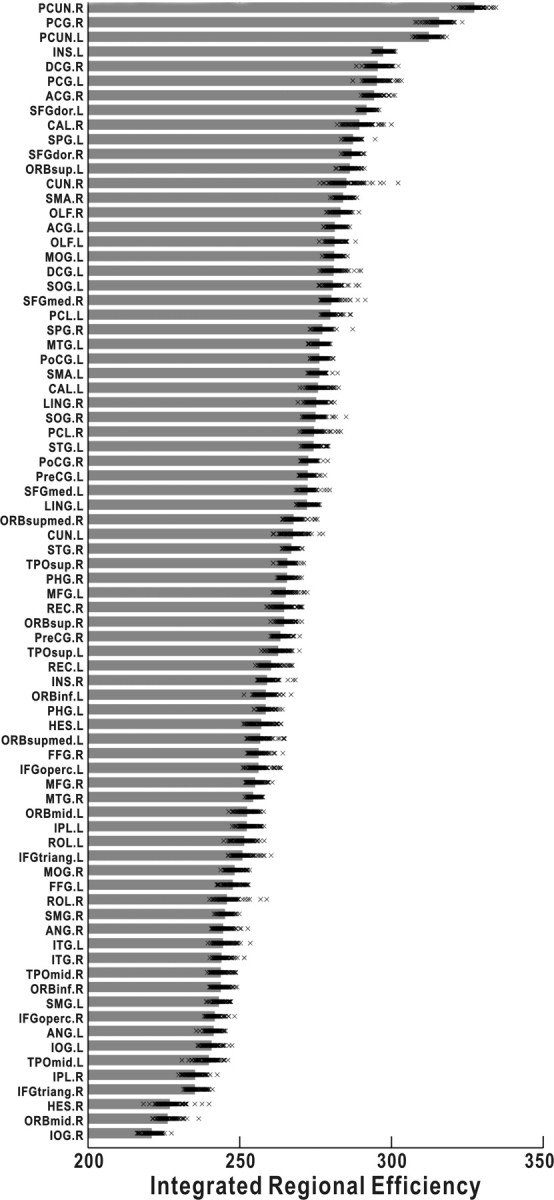
The integrated regional efficiency for all cortical regions. The cortical regions were ranked in the order of descending mean integrated regional efficiency across subjects. The gray bar represents the mean regional efficiency and each x mark corresponds to one subject. As shown, the PUN and PCG always have the highest regional efficiencies, regardless age and sex. For the abbreviations of cortical regions, see supplemental Table 1 (available at www.jneurosci.org as supplemental material).