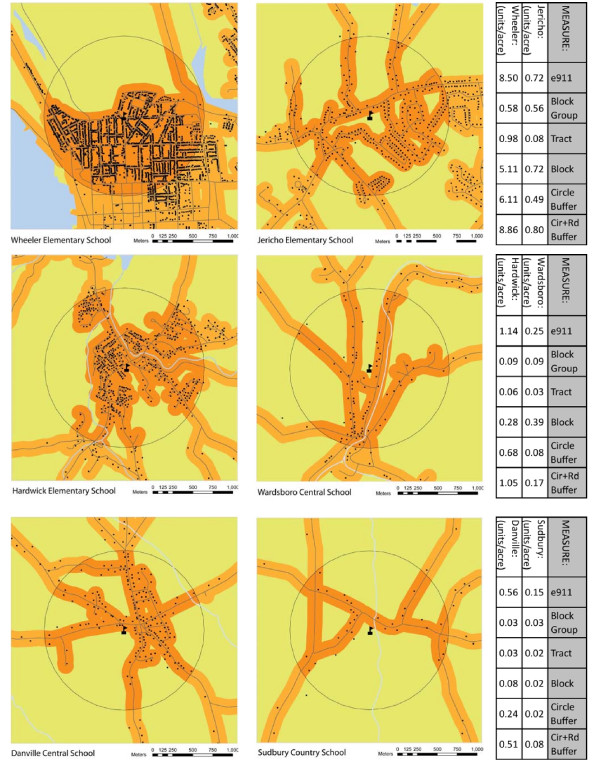
Figure 2.
Comparative maps and residential densities of three school neighborhood pairs illustrating differences in density calculations. The three school neighborhood pairs were chosen to illustrate scenarios in which residential densities appear to be comparable based on census block group but are substantially different based on e911 data.

