
Figure 3.
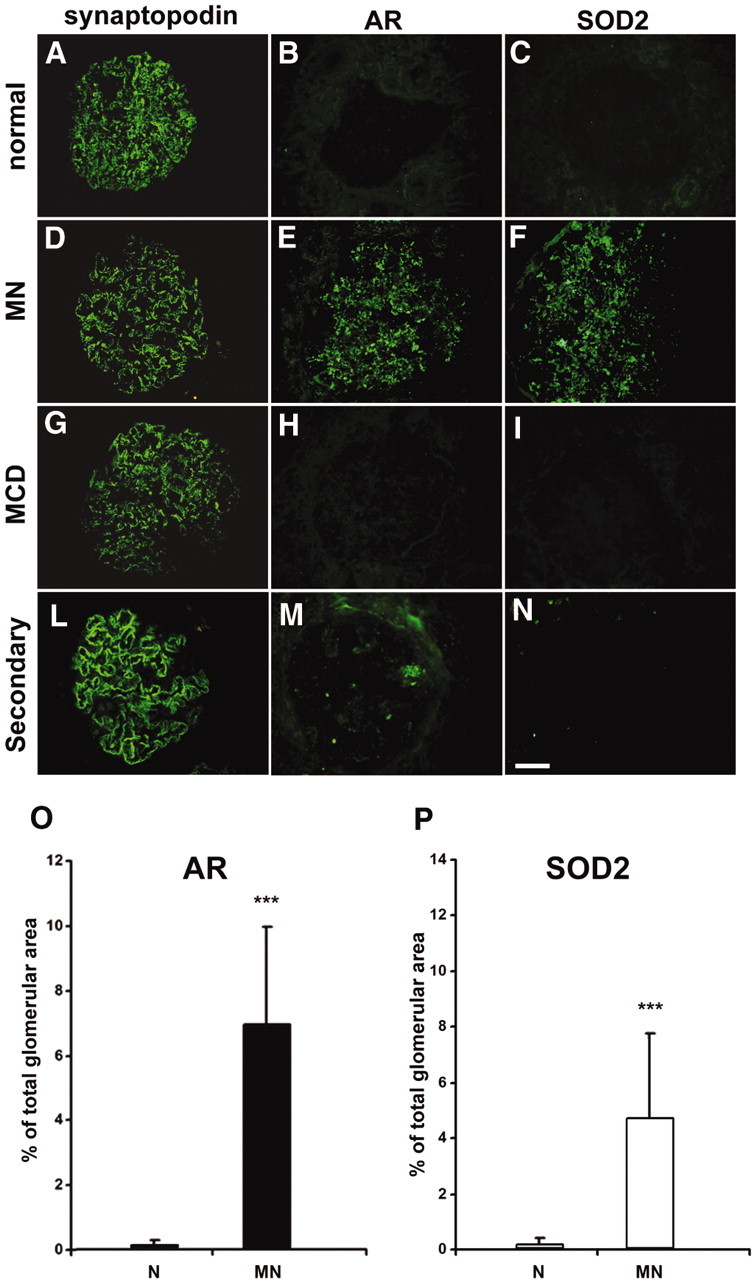
AR and SOD2 are expressed in renal biopsies of MN patients. (A through N) Representative images of renal biopsy specimens from normal patients (A through C), and patients with MN (D through F), MCD (G through I), and MN secondary to neoplasia (L through N) stained for synaptopodin (A, D, G, and L), AR (B, E, H, and M), or SOD2 (C, F, I, and N). AR and SOD2 staining is absent in tissues from normal individuals normal and from patients with MCD and only very weakly expressed in tissues from patients with MN secondary to neoplasia, whereas a marked glomerular staining for both proteins is evident in patients with MN. Synaptopodin is included to highlight glomerular structures. Bar = 200 μ. (O and P) Morphometric results of glomerular expression of AR and SOD2 in patients with MN. Bar graph shows glomerular expression of AR (■) and SOD2 (□), as measured by morphometric analysis on tissues from studied cases. Results are expressed as percentage of the positive area for each considered antibody on total glomerular area. The protein expression for both was increased in patients with MN, with high statistical significance (P < 0.001) when compared with control patients with a higher expression of AR in all considered glomeruli. Magnification, ×400.