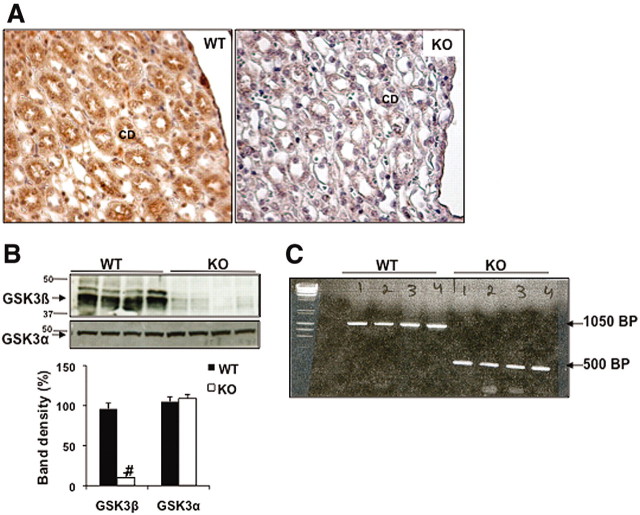
Figure 1.
These images show the generation of the renal CD-specific GSK3β KO mice. (A) Immunostaining for GSK3β in renal papillae of WT and KO mice. Original magnification, ×20. (B) Western blot analysis shows reduced GSK3β and not GSK3α levels in acutely isolated CDs from the renal inner medulla and papilla. #P < 0.0001. (C) Agarose gel showing PCR products of genomic DNA obtained from renal CDs. KO mice show smaller bands compared with the WT mice (floxed), owing to recombination resulting in deletion of GSK3β.

