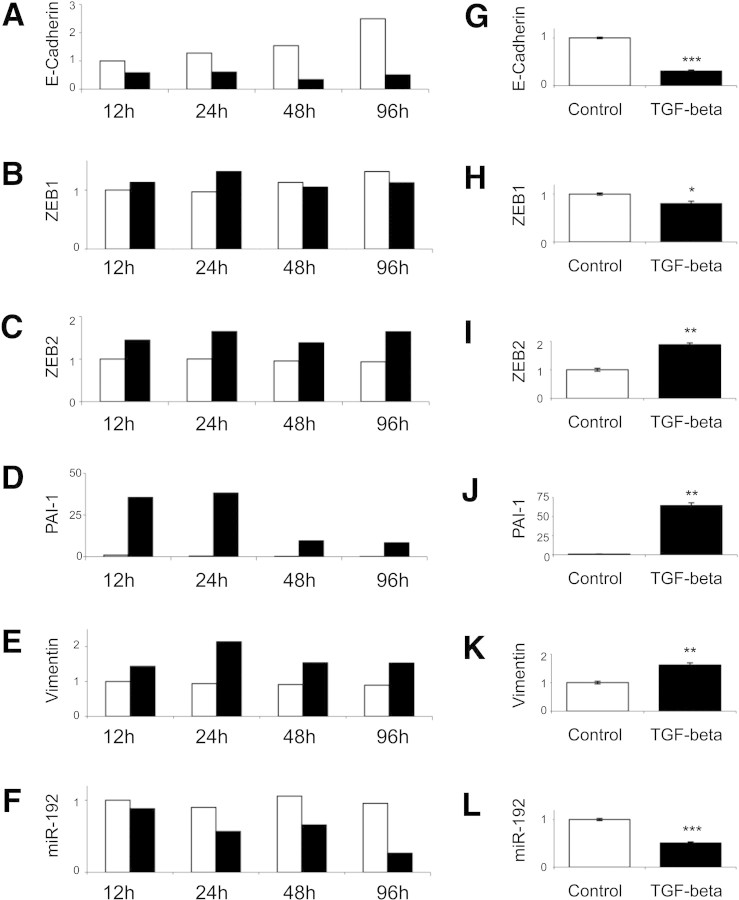
Figure 6.
PTC responses to TGF-β were examined by qRT-PCR. (A through L) HK-2 cells were cultured without serum for 48 hours and then incubated with 10 ng/ml TGF-β (■) or control medium (□) for indicated time points (A through F) or 96 hours (G through L). Expression of E-cadherin (A and G), ZEB1 (B and H), ZEB2 (C and I), vimentin (D and J), PAI-1 (E and K), and miR-192 (F and L) was measured by qRT-PCR and normalized to GAPDH expression. miR-192 was normalized to miR-16. Error bars (G through L) represent SEM (n = 3). *P < 0.05; **P < 0.005; ***P < 0.0005.

