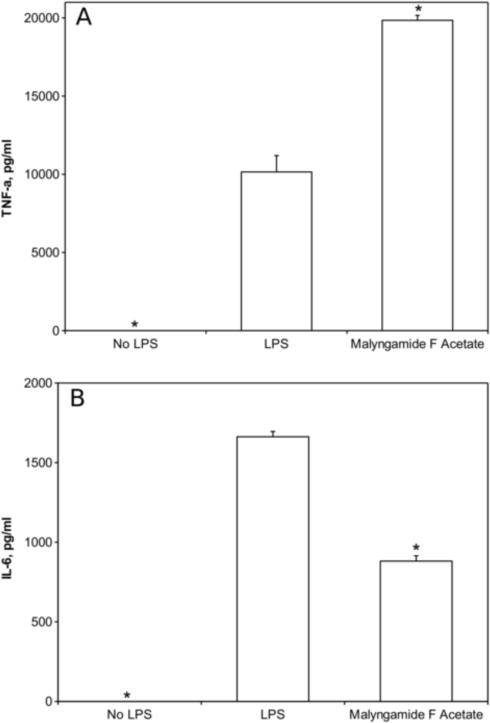
Fig. 5. Effects of malyngamide F acetate on TNF-α and IL-6 protein concentrations induced by LPS in RAW264.7 cells.
Cell media was isolated from the RAW264.7 murine macrophage cell line after treatment with malyngamide F acetate as described in Fig. 4 and analyzed by ELISA. Values are means ± standard deviation. * P < 0.01 compared to LPS treatment alone.

