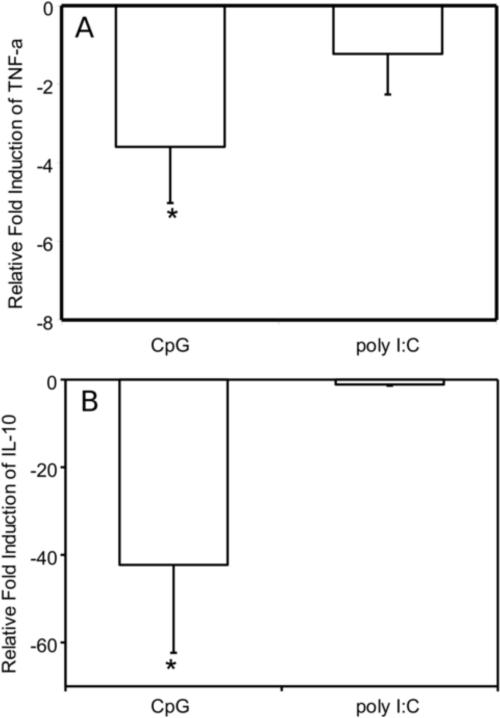
Fig. 6. Effects of malyngamide F acetate on TNF-α and IL-10 expression profiles in RAW264.7 cells after stimulation with CpG and Poly I:C as determined by quantitative RT-PCR.
Malyngamide F acetate (10 μg/ml) was incubated with RAW264.7 cells for 1 hour. Thereafter, CpG (10 μg/ml) or Poly I:C (50 μg/ml) was added and the cells were incubated for 6 hours at 37 °C. The media was aspirated, the cells were resuspended, and the RNA extracted using the TRIzol method. Next, cDNA was generated and a quantitative RT-PCR was performed using primers for 18S, TNF-α, and IL-10. Samples were assayed in triplicate. Bars represent the mean ± standard deviation; N = 3. * P-value < 0.01 compared to LPS treatment alone.

