
Figure 6.
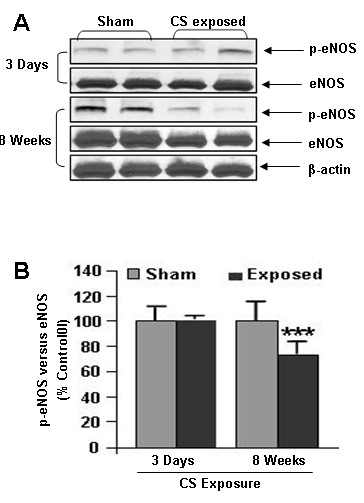
Phosphorylated and total eNOS levels in CS exposed rat lung. (A) A representative immunoblot picture of phosphorylated and total eNOS after 3 days and 8 weeks of CS exposure in rat lungs. Phophorylated and total eNOS levels were significantly reduced in 8 weeks, but not after 3 days of CS exposure compared to sham-exposed animals (n = 6). (B) Histograms represent the Mean ± SE of percentage of eNOS phosphorylation. *** p < 0.001 compared to sham-exposed animals.