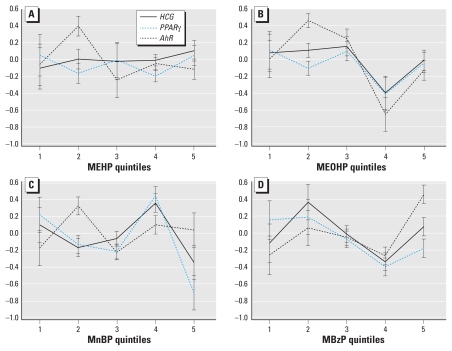
Figure 2.
Quintile plots of estimated mean Z-scores (± SE) of gene transcripts in the trophoblast differentiation pathway in relation to maternal urinary concentrations of MEHP (A), MEOHP (B), MnBP (C), and MBzP (D). B–D depict significant associations between MEOHP (p = 0.002), MnBP (p = 0.004), and MBzP (p = 0.01) quintiles and gene expression; C and D depict significantly different slopes among genes in relation to MnBP (p = 0.03) and MBzP (p = 0.01).

