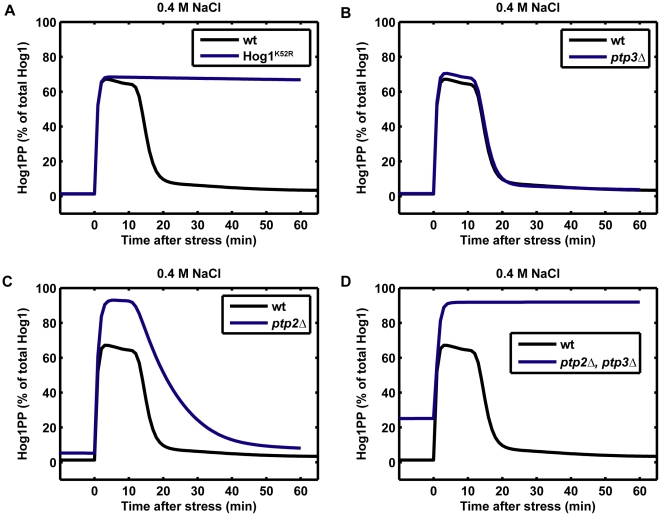
Figure 4. Model predictions for Hog1 phosphorylation response to step increase of 0.4 M NaCl in different mutants.
(A) Hog1 catalytically inactive mutant (Hog1K52R), In the model, we set ks1_Glyc = 0 for this mutant. (B) Knockout of cytoplasmic protein tyrosine phosphatase Ptp3 (ptp3 Δ). In the model, we set kdepho_Hog1PPc = 0 for this mutant. (C) Knockout of nuclear protein tyrosine phosphatase Ptp2 (ptp2Δ). In the model, we set kdepho_Hog1PPn = 0 for this mutant. (D) Knockouts of Ptp2 and Ptp3 (ptp2Δ, ptp3 Δ). In the model, we set kdepho_Hog1PPc = 0 and Kdepho_Hog1PPn = 0 for this mutant.

