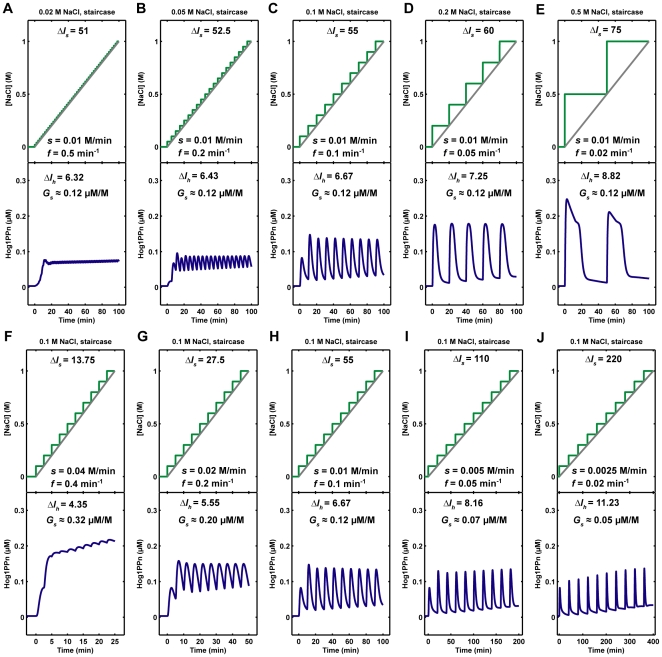
Figure 9. Nuclear phosphorylated Hog1 (Hog1PPn) response to different staircase NaCl stimulations.
ΔIs: NaCl integral change, ΔIh: integral change of Hog1PPn response, Gs: Hog1PPn response gain, s: slope of the staircase profile of NaCl, which is the ratio of final NaCl concentration to the duration of NaCl stimulation. f: frequency of the staircase steps, which corresponds to the inverse of the interval between staircase steps.

