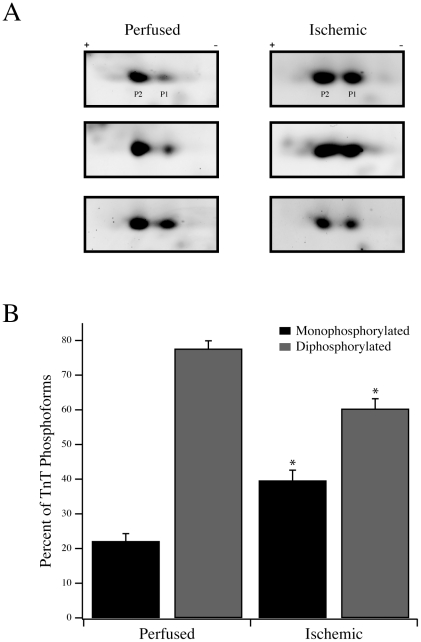
Figure 5. Troponin T phosphorylation in perfused and ischemic fibers.
(A) Two-dimensional SDS-PAGE with 3–5.6 NL IPG strips was used to resolve TnT into its phosphoforms. Three representative perfused and ischemic samples are shown with the two predominant phosphoforms labeled P1 (monophosphorylated) and P2 (diphosphorylated). (B) Following densitometric analysis, the percentages of monophosphorylated and diphosphorylated TnT, as a percentage of total TnT phosphoform expression (P1 + P2), are plotted for perfused and ischemic fibers. * P<0.05 compared to the corresponding perfused phosphoform.

