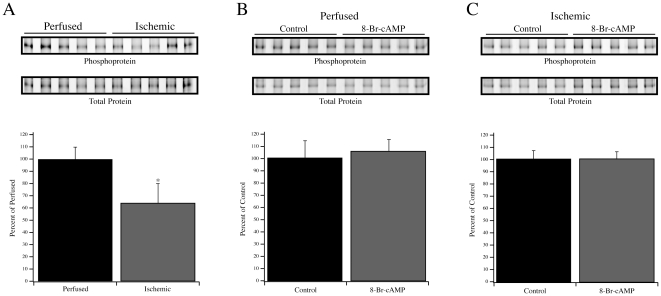
Figure 7. Phosphorylation of MYBP-C.
(A) Pro-Q Diamond phosphoprotein staining (Top row) and Deep Purple total protein staining (Bottom row) showing MYBP-C in perfused and ischemic homogenates. The graph represents the phosphoprotein signal divided by the total protein signal. (B) Analyses of MYBP-C phosphorylation in perfused and ischemic (C) fibers with and without 8-Br-cAMP treatment. Data presented are average ± S.E.M. * P<0.05 compared to the perfused fibers.

