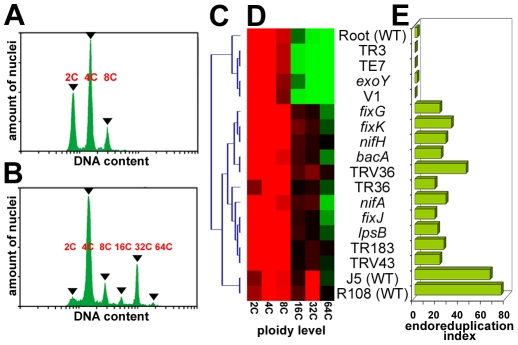
Figure 2. Ploidy levels in nodule cells as determined by flow cytometry.
(A,B) Measurement of the DNA content in the nuclei of roots (A) and in wild type nodules (B). The x-axis is DAPI fluorescence (DNA content) and the y-axis is the number of counts (amount of nuclei). The peaks at 2C, 4C, 8C, 16C, 32C and 64C are indicated with arrowheads. (C) Arborescence of the hierarchical cluster analysis of the data in (D). (D) Heat map for the hierarchical cluster analysis of the ploidy levels in the nodules of the mutants used in this study. The columns correspond to the type of nuclei at 2C, 4C, 8C, 16C, 32C and 64C. The colour code is red, high, black, intermediate and green, low relative amounts of nuclei expressed in %. Each row corresponds to a nodule or a root sample. The identity of the samples is indicated at the right of the heat map. (E) Endoreduplication index expressing the relative amounts of 16C, 32C and 64C nuclei in nodules. The identity of the samples is as in (D).

