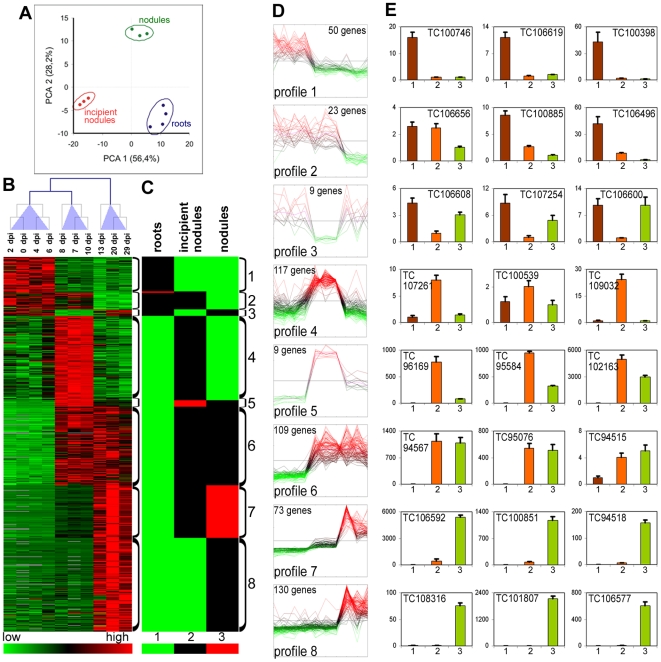
Figure 4. The transcriptome of wild type M. truncatula nodules.
(A) PCA analysis of microarray experiments. The two principal components and their fraction of the overall variability of the data (%) are shown on the x-axis and the y-axis. Clusters of experiments are circled and annotated as “roots”, containing time points 0, 2, 4, 6 dpi, “incipient nodules”, containing time points 7, 8, 10 dpi and “nodules”, containing time points 13, 20 and 29 dpi. (B) Heat map of the hierarchical cluster analysis of the microarray hybridization experiments. The columns correspond to the different time points indicated above the map and the arborescence indicates the similarity among transcriptomes. Below the heat map is a colour coded scale bar for the relative expression levels of genes. (C) Heat map of the levels of expression converted to integer values (1, 2 or 3 as indicated in the colour coded scale bar below the heat map) which indicate statistical differences (p<0.01) and gene expression strength in numerical order. (D) Expression profiles for all the genes in the profile measured by microarray analysis. The order of the points in the curves is 0, 2, 4, 6, 7, 8, 10, 13, 20 and 29 dpi. The same colour code as in (B) is used. (E) RT-qPCR measurements of expression patterns for 3 selected genes from each expression profile. The histograms are organized in one row per profile and annotated with the MtGI accession numbers. The relative expression levels, which correspond to the fold change relative to the sample with the lowest value (arbitrarily set to 1), are shown for R108 roots, 1 (brown bars), immature nodules, induced by Sm41, at 8 dpi, 2 (orange bars) and mature nodules at 15 dpi, 3 (green bars). The error bars correspond to the standard deviations for 3 biological repetitions.

