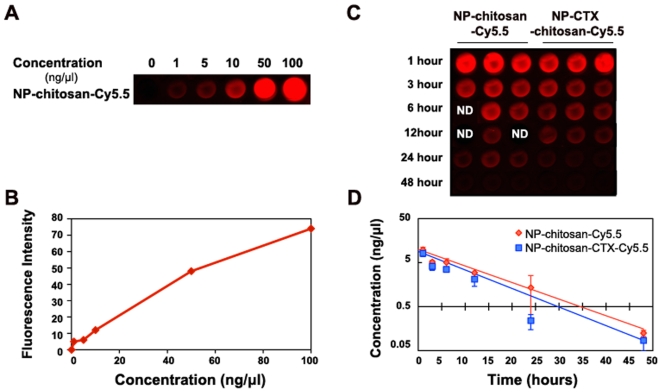
Figure 1. Serum half life of nanoparticles.
(A and B) Standard curve generated by quantifying intensity of known concentrations of NP-chitosan-Cy5.5 or NP-CTX-chitosan-Cy5.5. (C and D) Measured fluorescence intensity of nanoparticles in serum. Each data point represents the mean fluorescence intensity integrated above the baseline. This baseline subtraction avoids systematic errors from underlying autofluorescence. Error bars represent standard errors of the mean. The curve indicates an exponential decay curve fit to the data (n = 3 mice per time point).

