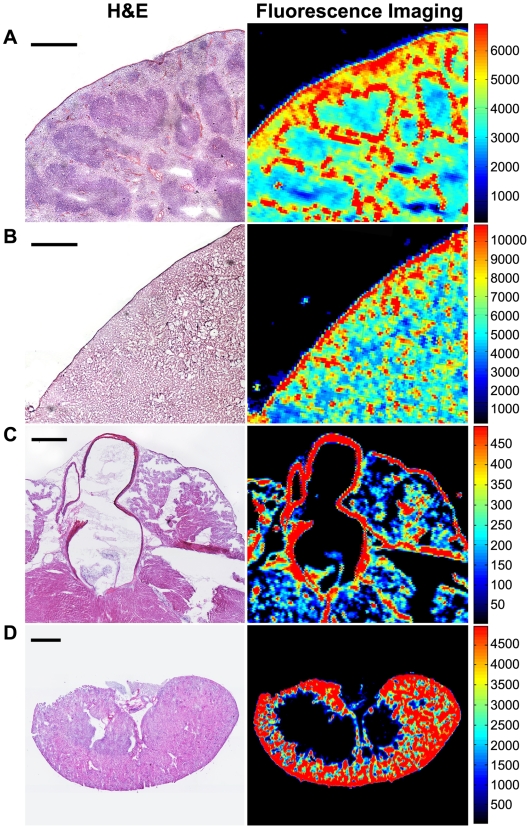
Figure 3. Comparison of H&E staining and high-resolution NIRF fluorescence imaging.
(A) In spleen, NIRF signal was observed in large cells within the white pulp (bar, 500 µm). (B) In liver, the pattern was less obvious, but clearly heterogeneous (bar, 500 µm). (C) In heart, the muscle walls of the atria and ventricle showed no signal above background but the walls of the aorta showed significant signal (bar, 50 µm). (D) In kidney, high NIRF signal was found in the renal cortex (bar, 1 mm). All images were taken of tissues that were harvested 24 hours post nanoparticle injection.

