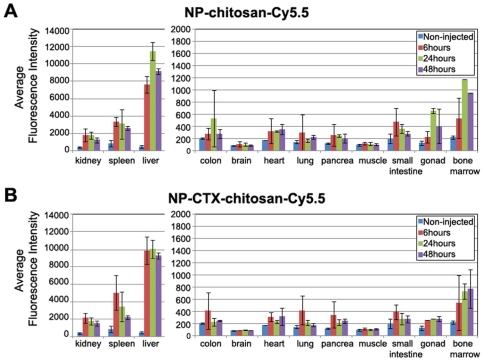
Figure 4. Biodistribution of NP-chitosan-Cy5.5 and NP-CTX-chitosan-Cy5.5 nanoparticles.
Relative fluorescence intensity was determined using the Odyssey scanner. Bars represent tissue from animals that were not injected with nanoparticles (blue), or injected with nanoparticles and harvested 6 hours (red), 24 hours (green), or 48 hours (purple) after injection. Bars represent the average of 3 animals for each nanoparticle at each time point. The error bars are standard deviation from the mean. (A) Ex vivo biodistribution of NP-chitosan-Cy5.5 non-targeted nanoparticle. (B) Ex vivo biodistribution of NP-CTX-chitosan-Cy5.5 targeted nanoparticle.

