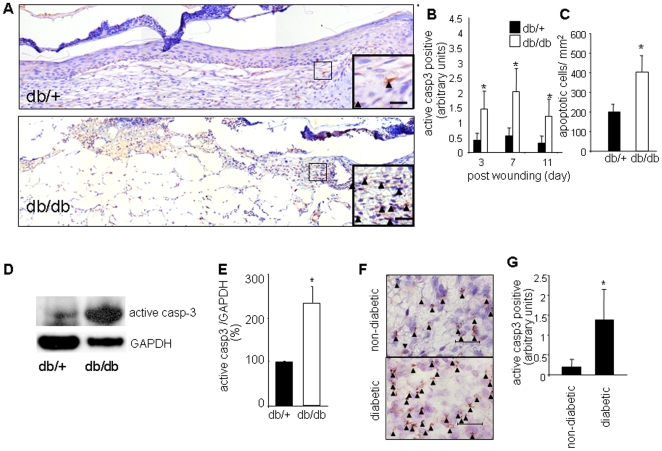
Figure 1. Increased number of apoptotic cells in wounds of diabetic mice and humans.
A, Representative mosaic images from day 3 wounds of diabetic (db/db) or non-diabetic (db/+) mice stained with active caspase 3 (brown). Counterstaining was performed using hematoxylin (blue). The mosaic images of whole wounds were collected under 20× magnification guided by MosaiX software (Zeiss) and a motorized stage. Each mosaic image was generated by combining 12–14 images. Inset: higher magnification image of the boxed area marked in the mosaic image. scale bar (inset) = 10 µm; B–C, quantification of active caspase 3 (B) or TUNEL positive cells (C). Data are shown as mean ± SD (n = 3); *, p<0.05 versus control non diabetic (db/+) mice; D. A representative Western blot image of active caspase-3 (casp-3) and GAPDH (housekeeping) in day3 wound tissue extracts of diabetic (db/db) or non-diabetic (db/+) mice. E. Densitometry data of blot shown in panel D. Data shown are mean ± SD (n = 3). *, p<0.05 compared to db/+ mice; F–G, wound biopsies were obtained from non-diabetic or diabetic patients presented at the wound clinic. Specimens (3 mm punch) were obtained from the edge of wounds immunostained using active caspase 3 (brown) antibody as a marker of apoptotic cells. Counterstaining was performed using hematoxylin (blue); F. microscopic images, arrows indicate positive cells. Scale bar = 50 µm; G, quantification of active caspase 3 positive areas shown in F. Data shown are mean ± SD (n = 3); * p< 0.05 versus non diabetic leg wounds.

