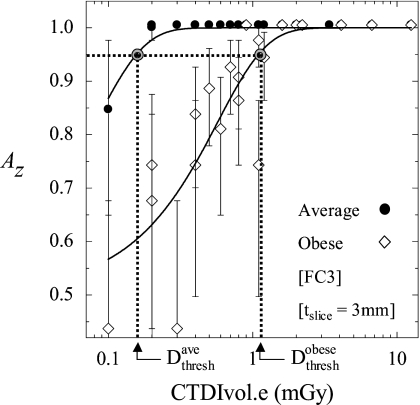
Figure 5.
Observer performance plotted as a function of dose for average and obese body habitus. Logistic functions were used to fit the measurement to a sigmoid (solid curves). Calculation of Dthresh is illustrated graphically as the dose at which observer performance falls to 0.95. Examples shown are for fixed reconstruction filter (FC3) and slice thickness (tslice=3 mm).

