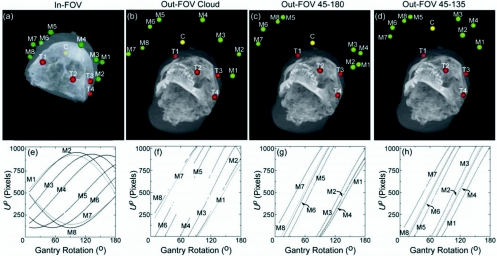
Figure 4.
Illustration of marker configurations, targets, and location of segmented BB centroids. Images (a)–(d) show maximum intensity projection renderings of CBCT images superimposed with the estimated locations of eight MM markers (M1–M8, green). The configuration centroid of the eight markers is also shown (C, yellow), as are the four target points (divot markers, T1–T4, red). In-FOV configurations involve MM markers affixed to the surface of the phantom, while Out-FOV configurations involve markers affixed to a curved acrylic plate [Fig. 1b] such that markers are present only in a subset of projections. The plots of (e)–(h) show the Up coordinate of each of the markers versus the C-arm rotation angle. These sinograms illustrate that in-FOV markers exist in all projections, while out-FOV markers enter and exit the projection FOV during gantry rotation, creating gaps in the sinogram. The smaller gaps are due to interference from bony anatomy. Each point in the Up coordinate also represents a line segment from to the source demonstrating the Δθ used to determine for each BB marker over all j projections.

