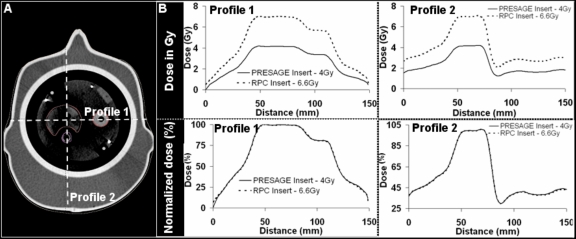
Figure 3.
Changing prescription dose from 6.6 to 4 Gy did not change the relative dose distribution in the Presage insert based on Eclipse calculations. Dose profiles from Eclipse along the dotted lines in (a) are shown in (b) for both the standard RPC insert and the Presage insert. The normalized dose distributions were identical (as shown in the lower panels in (b)), thereby enabling a direct comparison of Presage dose measurement with EBT dose measurement and Eclipse dose calculations despite the different density of the Presage insert.

