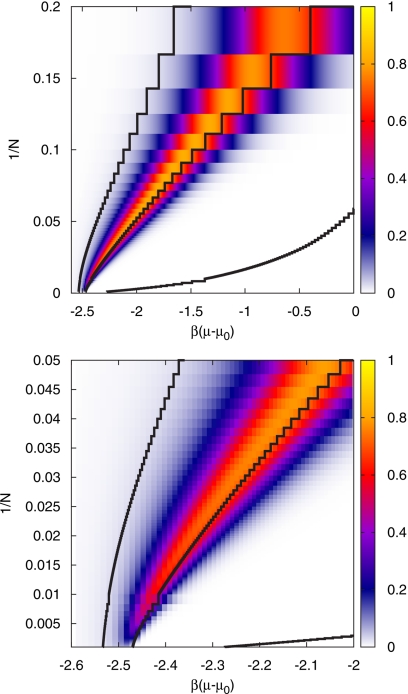
Figure 13.
Bistability map. Density plot of the bistability measure M of Eq. 59, which is close to 1 for a bistable system, for all investigated system sizes (top) and an enlarged view for large systems (bottom). The black solid lines are the lines of constant density ρ=0.01, 0.5, and 0.99 from left to right.

