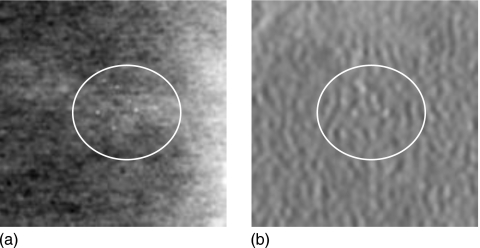
Figure 4.
(a) Shows the center projection (pixel-size=100 microns) of VD-DBT showing the slice with the MC cluster. (b) Shows the corresponding reconstructed slice (pixel-size=100 microns) of the UD-DBT. The area containing the MC cluster is enclosed in the circle in both the images. Dimension of each image is 1.5 cm×1.5 cm.

