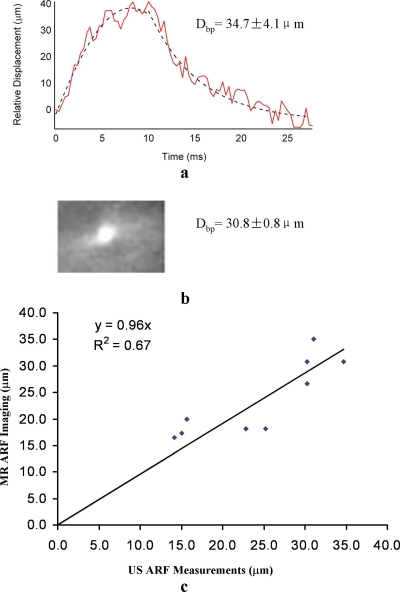
Figure 2.
Measurement results of ultrasound and MR ARF imaging. (a) One example of ultrasound measurement. The displacement values between 5 and 10 ms and 20 and 25 ms were used to calculate Dbp (displacement difference corresponds to the bipolar gradients in the MR measurement). The dotted line shows an exponential fitting. (b) The corresponding MR result. (c) Scatter plot of nine measurements. Measurements from the two modalities were in general agreement with a linear regression slope of 0.96 and R2=0.67.

