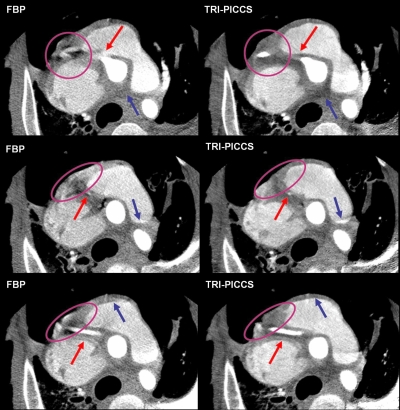
Figure 7.
Comparison of the image quality for a helical cardiac scan at 350 ms gantry rotation speed. The images in the left column were reconstructed using the conventional FBP method and the images in the right with the TRI-PICCS method. The arrows and elliptical circles correspond to regions where artifacts can be visualized in the FBP case but are corrected in the TRI-PICCS case.

