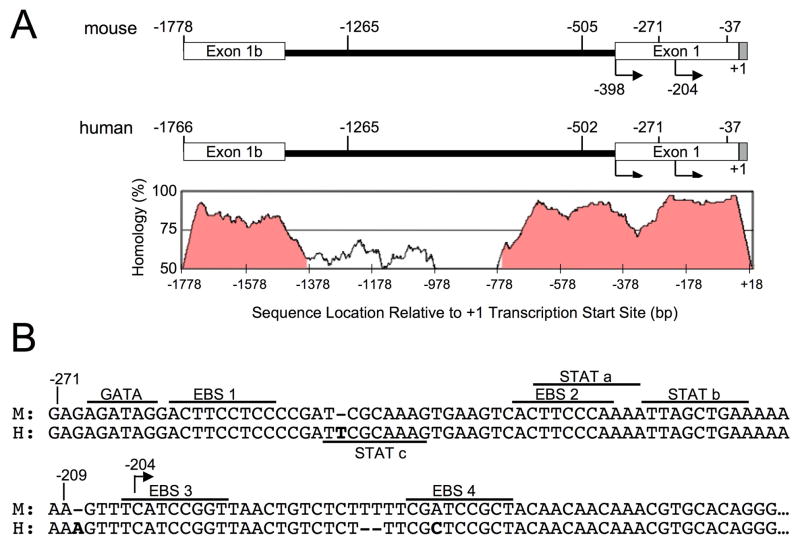
Figure 1. A schematic of the human and mouse Fli1−1766 to +18 regions.
(A) Comparison of the upstream regulatory region encompassing the human Fli1 proximal and distal promoter regions from −1766 to +18 with the equivalent region in the mouse (−1778 to +18). Below and aligned with the schematic is a VISTA map illustrating the percent of homology across the region. (B) Sequence alignment of human and mouse Fli1 promoter regions showing common putative transcription factor binding sites are underlined and labeled above the sequence. Unique to the human Fli1 promoter, a STATc binding site is underlined and labeled below the sequence. Numbering is relative to the +1 start site of the human sequence.

