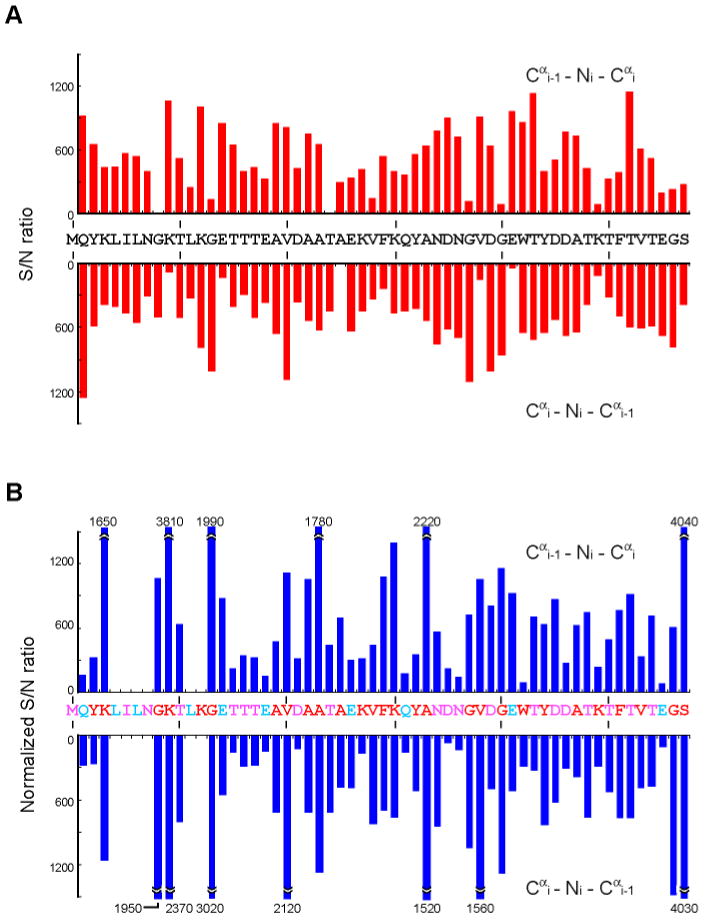
Figure 4.

S/N ratio in CANCA experiments with (A) 4 mM uniformly 2H15N13C-labeled GB1 samples and (B) 5 mM 2-13C glycerol labeling at conditions simulating “90 kDa” proteins. Experiments were recorded for 2 days for uniformly 2H15N13C-labeled or 4 days for 2-13C glycerol labeling samples with the delays TN optimized for sequential connectivities. The S/N ratio for (B) was normalized against (A) to account for differences in concentrations and measuring times. Upper and lower bars at positions i indicate Cαi-1-Ni-Cαi and Cαi-Ni-Cαi-1 correlations, respectively. For (B), residues that show S/N ratio of more than 1500 were clipped and the actual values are indicated. Residues colored in red are more than 80 % 13Cα labeled with [2-13C] glycerol, while cyan residues have less than 20% incorporation. Pink residues are 40-70% 13Cα labeled. The noise level was estimated from the median of the absolute intensity values of 10000 randomly selected points in the spectrum.
