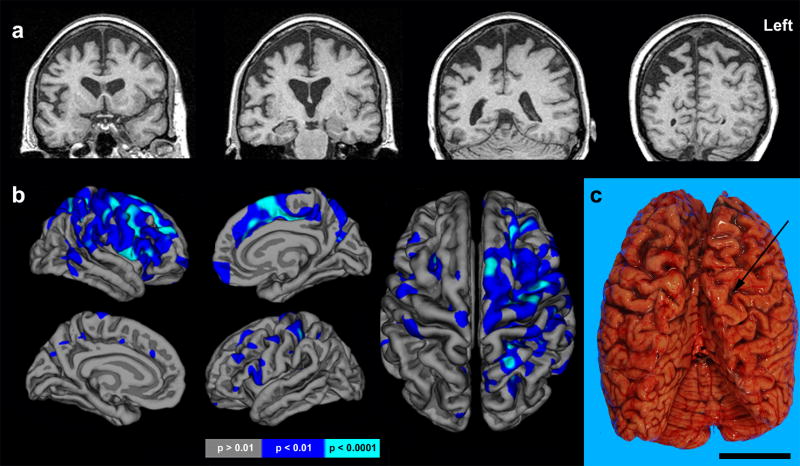
Figure 1. Neuroimaging features.
(a) Coronal (top) T1-weighted MRI at presentation. (b) Freesurfer comparison of GS to 28 healthy age-matched women shown at two levels of statistical significance revealed atrophy in right precentral sulcus, superior frontal gyrus, precentral gyrus, medial supplementary motor area, superior parietal lobule and postcentral gyrus. Foci of reduced cortical thickness were also apparent in homologous left hemisphere regions. (c) Dorsal view of fresh brain exhibiting marked, right greater than left, perirolandic atrophy. Arrow indicates Central Sulcus. Scale bar represents 5 cm.

