
Figure 2. Asymmetric, focal perirolandic degeneration.
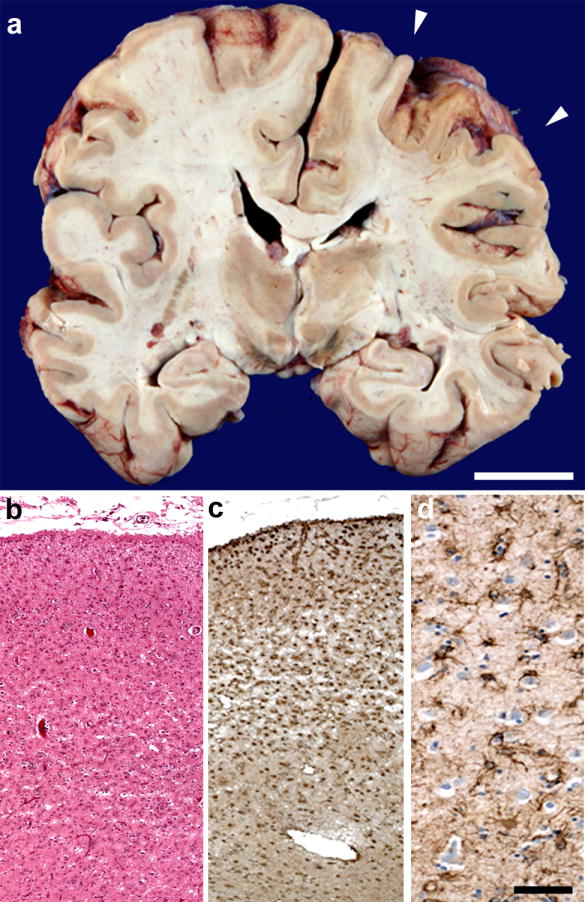
(a) Coronal view through postcentral gyrus (arrowheads) further highlights asymmetric atrophy. (b) Microscopically, right postcentral gyrus showed profound microvacuolation and gliosis, which included marked reactive astrogliosis (c-d). Scale bar in (a) represents 2 cm. Scale bar in (d) applies to (b-d) and represents 200 uM (b, c) and 50 uM (d). Hematoxylin and eosin, (b). Antibody to glial fibrillary acidic protein (c-d).